
SMITASIN
/DOCS/Unknown Unicast Flooding
2020-12-26: I had originally posted this in November of 2014, just about a year and three months after having started work as a Network Engineer. I'm sure that the implementation specifics of FreeBSD aliases and Juniper storm control have changed since then, so this may no longer be relevant to modern installations, but I think the tale of troubleshooting is an interesting one, and this provides a peek into the perspective of an early-career Network Engineer working on a challenging problem. I've copied over the content as-is, with only formatting changes to match my current site.
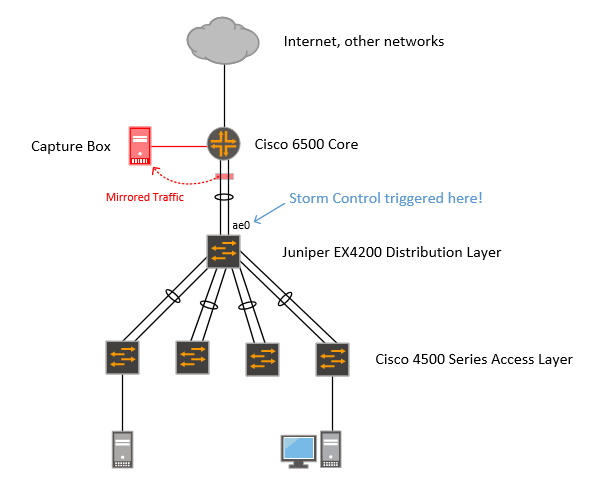
For several months we’ve been receiving syslog messages about storm control going into effect on the link between one of our Juniper EX4200 switches that is acting as a distribution switch for a decent sized building complex and its router:
Nov 4 05:31:49 myswitchname eswd[1308]: %DAEMON-1-ESWD_ST_CTL_ERROR_IN_EFFECT: ae0.0: storm control in effect on the port
My first inclination was to assume someone was causing a broadcast storm by introducing a loop, but this ended up being a bit more interesting of a problem. We run BPDU guard and storm control on downstream switches, so there are fewer situations where this could be due to a simple loop. Further, this was only being triggered on the uplink to the router, not any of the other nearly 20 downstream links to access layer switches.
Obviously, a packet capture was in order. We set up a monitor session on the router to mirror traffic on the 2x1GE port-channel to the EX4200 switches because the router’s located in a data center and it’s easy to rack mount a decently powerful capture box there. Here’s what it looked like:
However, when filtering on eth.addr==ff:ff:ff:ff:ff:ff I noticed that broadcasts were not a significant portion of traffic. Capturing from a mirror port on the router wasn’t going to be enough… I had no way just looking at that capture to differentiate between “known” unicast traffic and “unknown” traffic (traffic destined for a MAC address not in the switch’s MAC address table)… I’d need more data.
But first, there are some things to understand:
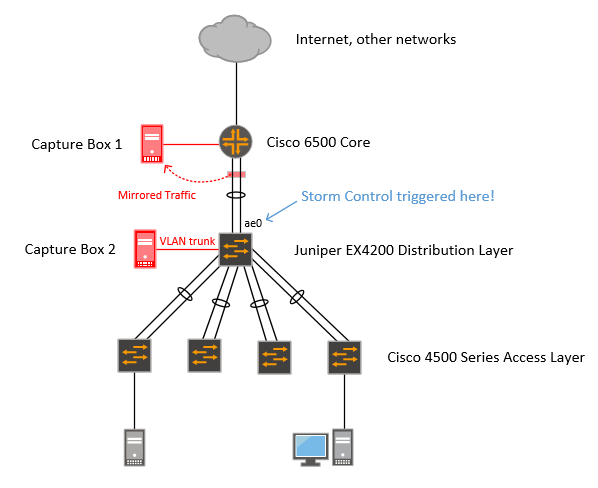
Looking at the packet captures on Capture Box 2, I noticed a lot of unicast/TCP traffic getting flooded to it. That’s not right… unicast is… unicast, it should go to one place, and Capture Box 2 wasn’t even configured for IPv4 on that link (and my capture filter was set to “ether host not myMACaddr”)…
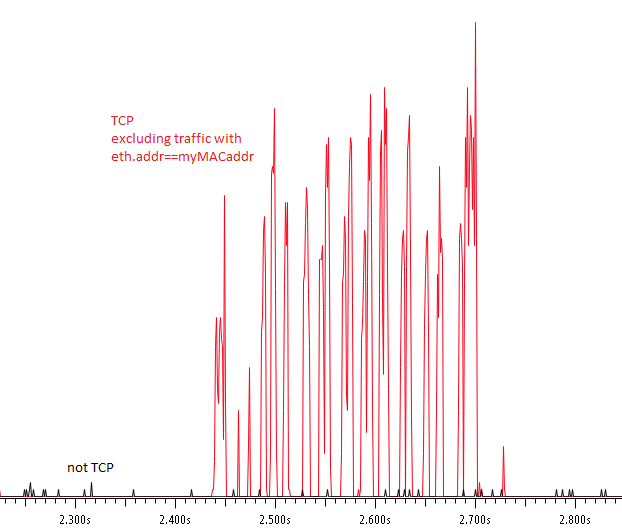
That pointed very strongly to “unknown” unicast being the cause of storm control getting triggered. Filtering the packet list by “tcp” made it pretty easy to identify the device, pretty much all of the packets had the same destination MAC address. So that answered “what?”, but not “why?”
To find that out I had to correlate the captures from Capture Box 2 (the trunk port on the Juniper switch) with those from Capture Box 1 (the mirror port on the router) to get more information about the flow that was causing storm control to trigger. Yep, I started at the router captures, went to the switch captures, then back to the router captures. When I looked for the MAC address that I saw being flooded on the switch, I noticed something strange… all the traffic was eth.dst==MACaddr1… none of it was eth.src==MACaddr1. Not a single packet in that capture was coming from that MAC address.
Address: MACaddr1
Packets: 4,823
Bytes: 6,555,190
Tx Packets: 0
Tx Bytes: 0
Rx Packets: 4,823
Rx Bytes: 6,555,190
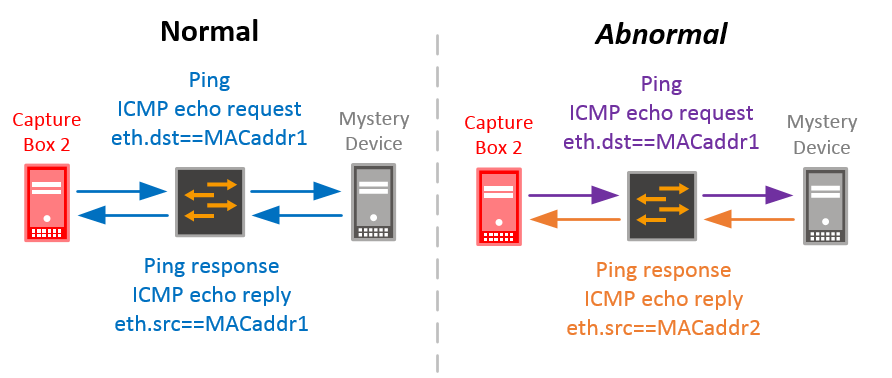
That’s very weird. This is TCP, and TCP has a three-way handshake! You have to send something back for it to work! Looking closer, there was a very close MAC address, MACaddr2, which was one character away from MACaddr1, and it was the opposite: everything for it was eth.src==MACaddr2, none of it was eth.dst==MACaddr2. The source/destination IPs and TCP sequence numbers matched, so it had to be the same flow. To confirm, I reconfigured the port that Capture Box 2 was on to be an access port on the same VLAN as that device and did a quick ping while capturing:
So… is that a problem? Logging into the switch, I did a quick “show ethernet-switching table | grep MACaddr1″ and sure enough, not present. MACaddr2 was, of course, because it was sending traffic. Also, on the router, both MACaddr1 and MACaddr2 were present in the ARP table. In fact, several IP addresses were ARPing with MACaddr1.
The next step I can’t really take full credit for. I had to contact the device owner to find out more about how it was configured. Turns out it’s a FreeBSD box running jails with multiple IP addresses aliased to two NICs on the same subnet… something like this:
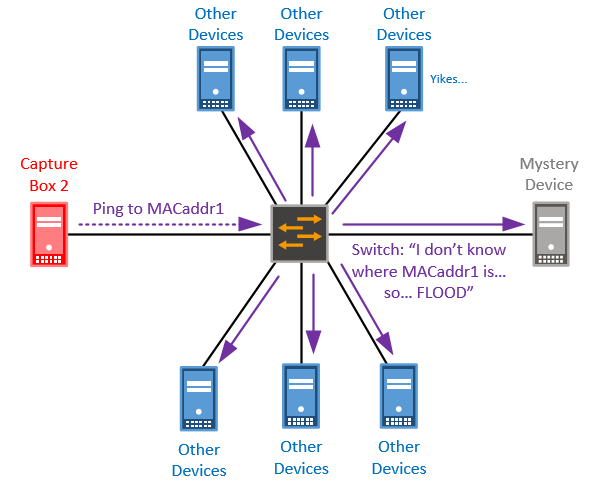
cat /etc/rc.conf
[...]
ifconfig_em0="inet 10.1.1.1 netmask 255.255.255.0"

ifconfig_em1="inet 10.1.1.2 netmask 255.255.255.0"
ifconfig_em1_alias0=inet 10.1.1.3 netmask 255.255.255.255"
ifconfig_em1_alias1=inet 10.1.1.4 netmask 255.255.255.255"
I threw together a quick FreeBSD lab and confirmed that behavior. So what’s the consequence of no packets being sent with MAC address MACaddr1? The MAC address never (or rarely) gets learned by the switch… and when a switch receives a frame for a destination which it does’t know (not in its MAC address table), it floods it out all ports:
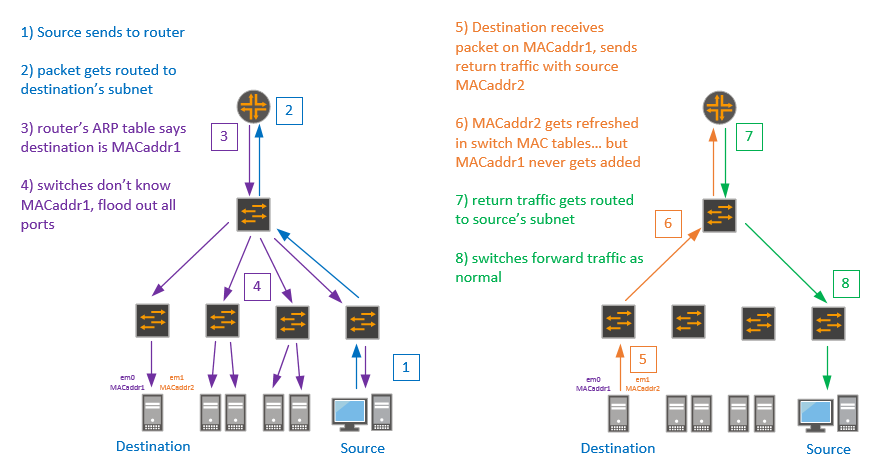
Here’s how the real flow looked (source was on a different subnet, VLAN and access switch, but same distribution switch):
So if the destination device was a regular desktop, this probably would have gone unnoticed. But regular desktops aren’t usually connected with two NICs, this was a server hosting a lot of websites, file shares, backups, etc. The traffic destined for it was significant, which meant the traffic getting flooded out all ports was significant. But it was still only connected at 1Gbps, so it wasn’t exactly saturating the ports by itself… some people may have noticed slower file transfers, but it wouldn’t have caused problems, right?
Well… about that storm control… it’s not a per-VLAN feature, it applies to the whole link, period. So once that unknown unicast traffic triggered it, any additional broadcast or unknown unicast traffic from the router was dropped.
And how can you catch this in the future? Easiest is just capturing traffic on an access port with filter ‘tcp’, if there’s a lot destined for one device that isn’t yours, that’s probably the culprit. If you’ve got a lot of VLANs, just trunk them all to your capture device (don’t mirror, you specifically want to see what’s being flooded).
host1$ cat /etc/rc.conf
[...]
ifconfig_em0="inet 10.1.1.10 netmask 255.255.255.0"
host2$ cat /etc/rc.conf
[...]
ifconfig_em0="inet 10.1.1.20 netmask 255.255.255.0"

ifconfig_em1="inet 10.1.1.30 netmask 255.255.255.0"
ifconfig_em1_alias0=inet 10.1.1.40 netmask 255.255.255.255"
host2$ iperf3 -s
host1$ iperf3 -c 10.1.1.40 -P2 -t600